
Cluster load in PowerCLI
Edit 01.04.2013 : A few script modification following a very nice observation by hypervisor (as usual :p)
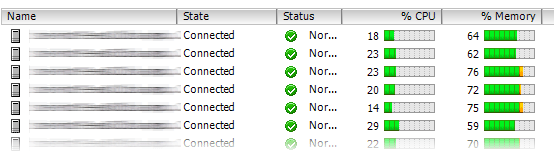
It’s been a while we wanted to make a PowerCLI fancy display for vSphere cluster load, in a kind of way VIClient does for server load:
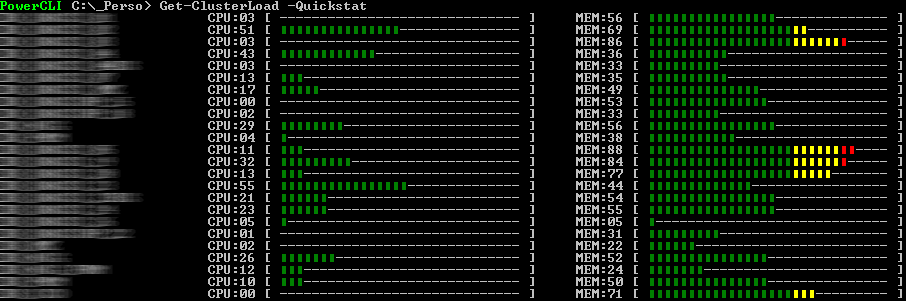
So here is a PowerCLI script that will display your cluster load in CLI:
We had as much fun making the graphical ascii art display as getting the statistics data (especially with the quest of perfect character in order to display filling bar ^^). This PowerCLI script is a Get-ClusterLoad function that took some non-mandatory parameters:
.PARAMETER ClusterName
 The cluster name or names separated by coma
 .PARAMETER Quickstat
 Switch, when true the method to get stats is based on quickstats through summary child properties. If not, the method will use PerfManager instance with QueryPerf method in order to get non computed stats. The default for this switch is $true.
So this function can be used to display the load of all your clusters (default behavior with no argument):
Get-ClusterLoad
You can also display specific cluster load (by giving cluster name separated by comma):
Get-ClusterLoad -ClusterName vCluster01,vCluster02
You can also force reals stats usage instead of quick stats:
Get-ClusterLoad -Quickstat:$false
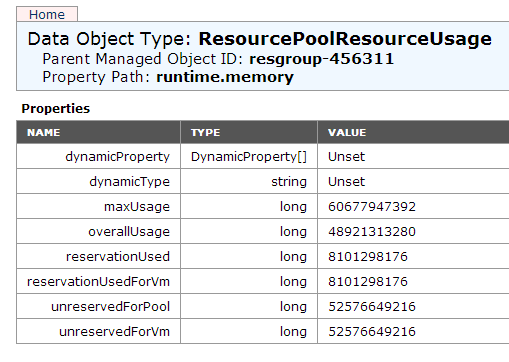
The 2 ways of retrieving statistics data are pretty much different regarding execution time. First of all, the default method will retrieve quick stats available with runtime.memory and runtime.cpu properties from cluster root resource pool (named Resources, with ManagedObjectReference:ResourcePool type) :
This method is fast as it’ll only retrieve already computed values in order to get cluster load (just a few seconds for almost 200 ESXi servers):
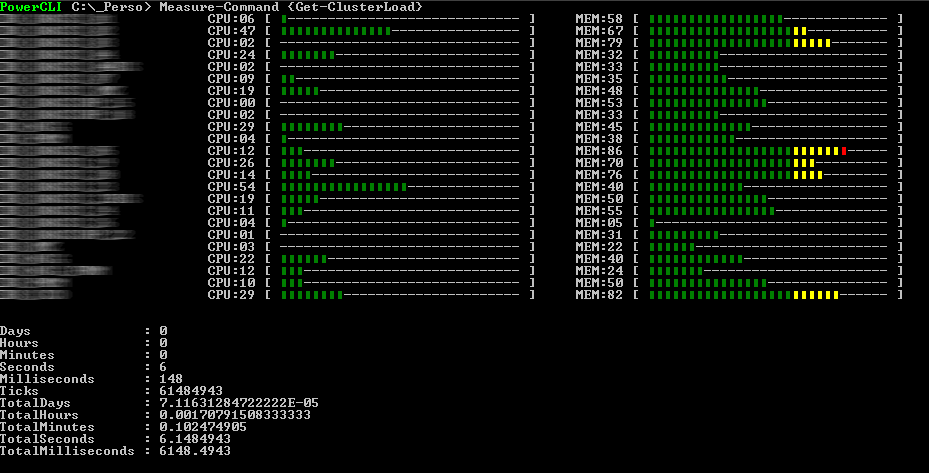
The second method (using -QuickStat:$false switch) will retrieve mem.consumed.average and cpu.usagemhz.average statistic counters from each cluster. This load will be an average one (so it can be slightly different from the load generated with the first method) and will be longer to compute (a little more than 2 minutes for almost 200 ESXi servers):
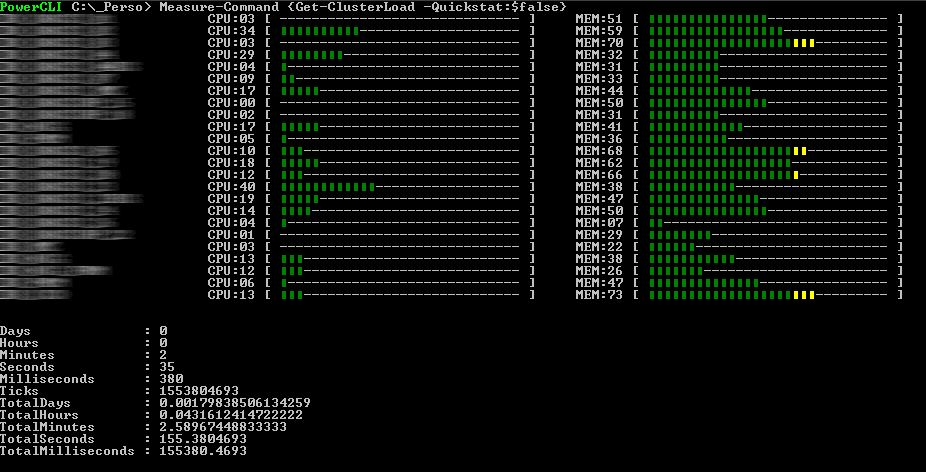
This function is not extremely useful as-is (except for the fun part with ASCII art ^^), but we’re working on a plugin that could be added to vCheck in order to have these information in the sent report. We’ll update this post when it’ll be finished.
The function displaying graph bar with percentage input is the sub-function Show-PercentageGraph (line 37 to 50):
function Show-PercentageGraph([int]$percent, [int]$maxSize=20) {
    if ($percent -gt 100) { $percent = 100 }
    $warningThreshold = 60 # percent
    $alertThreshold = 80 # percent
    [string]$g = [char]9632 #this is the graph character, use [char]9608 for full square character
    if ($percent -lt 10) { write-host -nonewline "0$percent [ " } else { write-host -nonewline "$percent [ " }
    for ($i=1; $i -le ($barValue = ([math]::floor($percent * $maxSize / 100)));$i++) {
        if ($i -le ($warningThreshold * $maxSize / 100)) { write-host -nonewline -foregroundcolor darkgreen $g }
        elseif ($i -le ($alertThreshold * $maxSize / 100)) { write-host -nonewline -foregroundcolor yellow $g }
        else { write-host -nonewline -foregroundcolor red $g }
    }
    for ($i=1; $i -le ($traitValue = $maxSize - $barValue);$i++) { write-host -nonewline "-" }
    write-host -nonewline " ]"
}
You can modify the graph width in the sub-function Show-PercentageGraph (line 37):
[int]$maxSize=20
You can modify the threshold for color change for warning/alert in the sub-function Show-PercentageGraph (line 39/40):
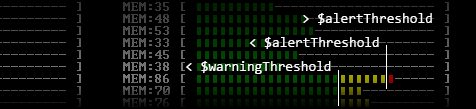
$warningThreshold = 60 # percent
$alertThreshold = 80 # percent
The script is available for download here (just rename the extension in .ps1) : Get-ClusterLoad.ps1